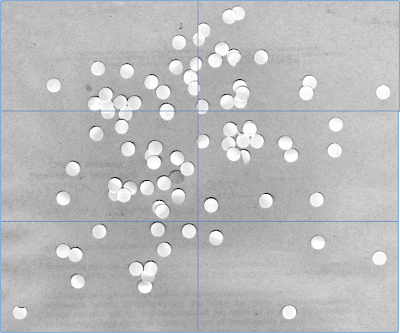
The purpose for this activity is to learn the techniques of properly segmenting/separating the region of interest (ROI) from the background. One technique is the binarization of the image. However, this method is not enough sometimes especially when there is an overlap in the graylevel distribution of the background and the ROI. One way to improve the separation of the ROI from the background using this technique is by creating subimages. The goal would be to have less ROI in the subimage to avoid the overlapping in the graylevel distribution. The threshold value may differ for the different subimages. This means the more the subimages are, the higher the success that the ROI will be well segmented from the background.
Unfortanately, binarization even with so many subimages is still not enough. A technique can be employed in the binarized subimages to further clean them. This is with the use of the morphological operations we learned in the previous activity, i.e., erosion and dilation. For this activity, we will be using new operations which utilizes both erosion and dilation. Opening is the operation in which the image is eroded first, and then the result is dilated using the same structuring element (SE) or another one. Closing, on the other hand, is the operation that dilates first, and then erodes the resulting image.
Unfortanately, binarization even with so many subimages is still not enough. A technique can be employed in the binarized subimages to further clean them. This is with the use of the morphological operations we learned in the previous activity, i.e., erosion and dilation. For this activity, we will be using new operations which utilizes both erosion and dilation. Opening is the operation in which the image is eroded first, and then the result is dilated using the same structuring element (SE) or another one. Closing, on the other hand, is the operation that dilates first, and then erodes the resulting image.
Proper segmentation is required especially when dealing with image-based measurements. For example, in this activity, we would like to calculate the area of the circles/holes. To be able to arrive at an accurate value, the image has to be prepocessed first.
The following were done to have a well-segmented ROI from the background:
1.) The images were subdivided into 6 subimages. (see Figure 1)
2.) For each subimage, the histogram was generated. (see Figure 2)
3.) Choosing a threshold value for each subimage (~0.80), the subimages were binarized. (see Figure 3)
4.) The binarized images were then further cleaned using only the opening function. (see Figure 4) I didn't find the closing function usefeul becauses it does not separate nearly connected blobs but instead treat them as one blob. On the other hand, using both opening and closing functions do not give that much difference in the calculation of the area.
5.) The blobs in the each subimage are then labeled using the function bwlabel(). It simply assigns an integer number to all connected pixel locations. Different groups of connected pixels have different assigned values. (see Figure 5)
6.) The area of each blob in the subimage is then calculated. This was done by simply getting the size of the blob with that assigned integer number. A bar graph of the calculated areas arranged in decreasing order is then established (see Figure 6) Extreme values are not included in the calculation of the mean area and standard deviation. In this case, only data 10-52 are included. The calculated mean area is 521 pixels while the standard deviation is 23.


No comments:
Post a Comment